Ocean Eddy Detection and Lifecycle Tracking
Processed multi-year NetCDF datasets to detect mesoscale eddies, extract physical parameters, and track lifecycle evolution across time. This case study uses only public-domain, synthetic, or sanitized examples.
Highlights
What the pipeline produces and how it's organized end-to-end.
Objective
- Detect mesoscale eddies from gridded ocean data.
- Extract physical metrics and track eddy lifecycles.
- Summarize statistics and visualize trajectories.
Approach
- Ingest NetCDF data and standardize coordinates and time.
- Apply detection criteria and label eddy features per timestep.
- Track features through time and compute lifecycle metrics.
Tools
- Python: xarray, NumPy, pandas for data processing.
- Geospatial plotting for trajectory maps and diagnostics.
- Workflow automation for multi-year batch runs.
My Role
- Built the full pipeline from ingest through detection to tracking.
- Defined outputs and diagnostics for quality control.
- Created summary visuals for interpretation and reporting.
Key Takeaways
- Consistent preprocessing is essential for stable cross-timestep tracking.
- Diagnostic outputs help validate detection sensitivity and reduce false positives.
- Trajectory and metric summaries communicate eddy behavior clearly to interdisciplinary audiences.
Data Preparation
Standardize time, grids, and masks across multi-year files to ensure consistent and reproducible detection.
- Load multi-year NetCDF files and harmonize coordinate systems.
- Subset region and time range; apply quality-control rules.
- Prepare and validate variables required for detection.

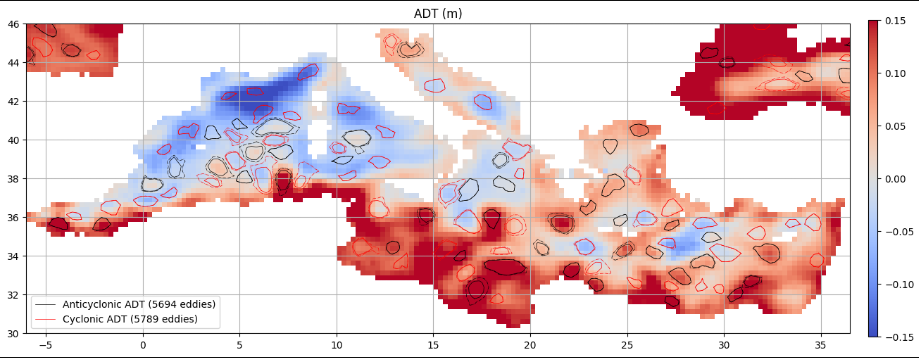
Detection
Identify candidate eddy structures and label discrete features for each timestep in the dataset.
- Apply detection criteria using thresholds and shape constraints.
- Label and store per-feature attributes such as position, size, and polarity.
- Generate diagnostics to verify and tune detection sensitivity.
Tracking & Outputs
Connect detected features through time to build complete trajectories and summarize eddy lifecycles.
- Associate features across timesteps using nearest-neighbor matching.
- Compute lifecycle metrics: duration, intensity, and displacement.
- Export trajectory maps, diagnostic plots, and summary tables.

Data Privacy Note
This case study is generalized and displays only public, synthetic, or sanitized examples. No client-confidential information is included.