Spatiotemporal Analysis of Monthly Rainfall Effects on River Turbidity
Utilized Google Earth Engine, satellite imagery, and rainfall data to analyze spatiotemporal patterns of river turbidity and identify areas with potential siltation risk.
Highlights
What this assessment was designed to answer and how it's structured.
Objective
- Map spatial turbidity patterns and detect siltation hotspots.
- Track changes through time — seasonality and anomalies.
- Produce clear maps and summaries for interpretation.
Approach
- Assemble imagery collection and apply QA masking.
- Compute turbidity proxy (NDTI) and aggregate per period.
- Summarize trends and create monthly and seasonal maps.
Tools
- Google Earth Engine for cloud-scale imagery processing.
- QGIS / ArcGIS for cartographic outputs as needed.
- Python for post-processing and time-series plotting.
My Role
- Designed the workflow and quality-control approach.
- Implemented index extraction and map outputs in GEE.
- Produced interpretation-ready visuals for reporting.
Key Takeaways
- Monthly composites reduce noise and significantly improve spatial interpretability.
- Rigorous QA/QC — cloud and shadow masking — is critical for defensible results.
- Map and trend summary combinations communicate findings effectively to non-technical audiences.
Data Assembly & QA
Build the multi-year image collection and apply masking to remove noise and improve signal quality before index computation.
- Select imagery source and define the analysis time range.
- Apply cloud, shadow, and water masking appropriate to the sensor.
- Standardize band naming and resolve spatial resolution handling.
- Obtain rainfall data from the nearest weather station

Index Computation
Compute the turbidity proxy index (NDTI) per scene and generate temporal composites for spatial and statistical analysis.
- Calculate NDTI per scene and harmonize outputs across the time series.
- Create monthly and seasonal composites to reduce noise.
- Extract zonal statistics for areas of interest and river segments.
Rainfall Analysis
Examine monthly and seasonal rainfall patterns to contextualize turbidity variability and identify precipitation-driven siltation signals.
- Extract and aggregate rainfall data across the study period.
- Identify seasonal patterns, anomalies, and high-intensity events.
- Cross-reference rainfall peaks with turbidity spikes to infer drivers.
Outputs & Interpretation
Deliver hotspot maps, time-series summaries, and export-ready figures that support interpretation and reporting.
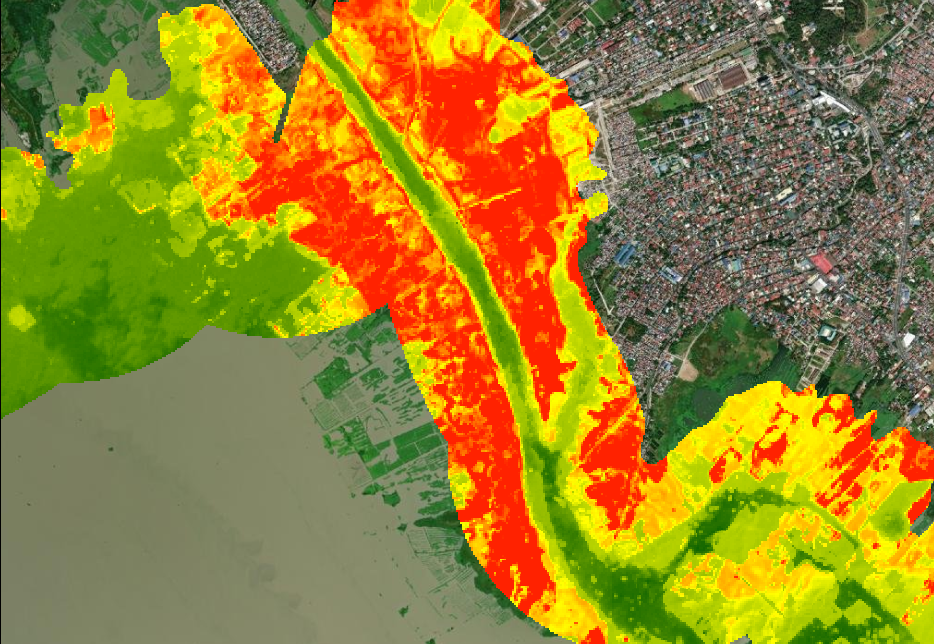
- Hotspot maps and change detection summaries highlighting siltation risk zones.
- Time-series plots showing monthly and seasonal turbidity trends.
- Export maps and summary tables formatted for reporting packs.
Sample Output Summary
| Parameter | Result | Interpretation |
|---|---|---|
| Wettest Month | August | Peak rainfall drives maximum runoff. |
| Maximum Monthly Rainfall | 420 mm | Indicates strong monsoon influence. |
| Average Turbidity (Dry Season) | 6–12 NDTI | Background sediment levels. |
| Average Turbidity (Wet Season) | 18–32 NDTI | Elevated sediment transport. |
| Turbidity Hotspot Zones | Lower river bends & tributary confluences | Likely areas of erosion or sediment deposition. |
Data Privacy Note
This case study is generalized and displays only public, synthetic, or sanitized examples. No client-confidential information is included.